The Many Faces of the Metropolis: Unsupervised Clustering Of Urban Environments In Mumbai Based On Visual Features As Captured In City-wide Street-view Imagery
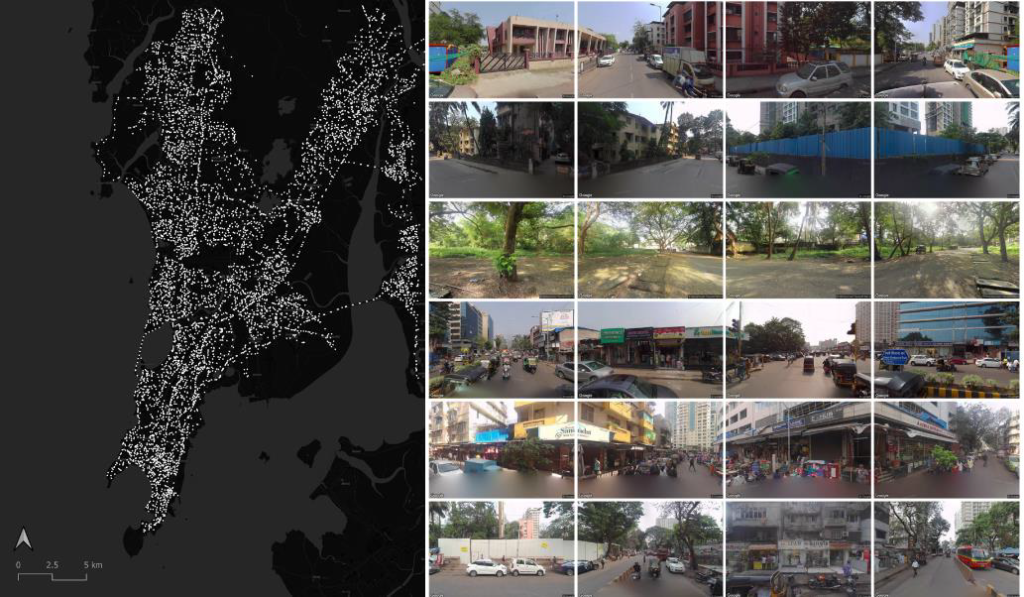
The larger visual identity of a city is often a blend of smaller and distinct visual character zones. Despite the recent popularity of street-view imagery for visual analytics, its role in uncovering such urban visual clusters has been fairly limited. Taking Mumbai as a demonstrative case, we present what is arguably the first city-wide visual cluster analysis of an Indian metropolis. We use a Dense Prediction Transformer (DPT) for semantic segmentation of over 28000 Google Street View (GSV) images collected from over 7000 locations across the city. Unsupervised k-means clustering is carried out on the extracted semantic features (such as greenery, sky-view, built-density etc.) for the identification of distinct urban visual typologies. Through iterative analysis, 7 key visual clusters are identified, and Principal Component Analysis (PCA) is used to visualize the variance across them. The feature distributions of each cluster are then qualitatively and quantitatively analysed in order to examine their unique visual configurations. Spatial distributions of the clusters are visualized as well, thus mapping out the different ‘faces’ of the city. It is hoped that the methodology outlined in this work serves as a base for similar cluster-based inquiries into the visual dimension of other cities across the globe.
This work was published by the Association for Computer-Aided Architectural Design Research in Asia (CAADRIA). Read the full paper here:
https://papers.cumincad.org/cgi-bin/works/paper/caadria2023_167
Here is a summary of our methods and findings.
VISUAL DATA COLLECTION
For city-level collection of visual data, the street network configuration for Mumbai was downloaded from the Open Street Maps database using the osmnx network analysis library for Python. Download locations were then generated for every 250 m intervals along the street network. The panoIDs (street view image IDs) were then programmatically queried for each of these locations using the Google Street View API. A list of all valid panoIDs, along with their latitude and longitude values were stored as a .csv file. PanoIDs for a total of 7104 locations were collected across the city. Four separate street view images (corresponding to heading 0, 90, 270 and 360) were then programmatically downloaded for each panoID, using the API.

VISUAL FEATURE EXTRACTION + MAPPING
For extraction of semantic visual features from the downloaded street-view imagery, a pre-trained Dense Prediction Transformer (DPT) (Ranftl et al. 2021) was used. The DPT had been trained on the ADE20K dataset (Zhou et al. 2017), and was able to segment each image pixel into one of 150 semantic classes, such as tree, sky, building, automobile, person, road etc.

The extraction of geolocated visual content information allowed for the mapping of visual features across Mumbai for exploratory analysis. For a given location (panoID), the mean feature scores for each class were computed across the 4 images collected from that point.

UNSUPERVISED CLUSTERING BASED ON VISUAL FEATURES
Cluster analysis was carried out on two levels. Firstly, the visual character of each cluster was both quantitatively and qualitatively evaluated. To do this, the cluster centroids were computed for each cluster, and a K-Nearest Neighbours (KNN) algorithm applied to identify the k = 5 samples from the database which were nearest to these centroids. These samples within a cluster were thus the most representative of the visual character that the cluster embodied.

It was important for us to evaluate not only the visual feature distributions of the clusters, but also the spatial distribution of the same. Such an analysis allows for the identification of visual character zones that are spatially localised as well.

REFLECTIONS
While many of the findings from this study empirically validate common knowledge for those familiar with the city, the demonstrated analytical methodology can indeed be applied to any city across the world. Despite recent developments in urban visual analytics, the use of unsupervised clustering for visual character analysis is a novel approach. Moreover, the added value of employing unsupervised methods in this context lie in the fact that such methods rely purely on visual feature data to unravel patterns amongst sampled locations in a bottom-up manner – patterns which are often extremely valuable to designers and planners. This allows for meaningful qualitative analyses of many complex perceptual and affective attributes, the structured and quantitative representation of which is extremely challenging within supervised-learning frameworks.
The methodology is also valuable from an experiential standpoint. While every city has a unique overall ‘image’, such an image is seldom homogenous. In most cases, a diverse set of spaces and places come together in the city, distributed in unique proportions and unique configurations. The larger visual identity of the city is thus rooted in each of these micro identities. The methods demonstrated through this work allow us to empirically uncover and analyse the nuances of such micro-identities – thus systematically unravelling the rich and diverse faces of the metropolis.

